
Jeff Franklin is sharing this week the main observations of the season in terms of temperature and precipitation until July 12. Always good to remember, this information is coming from Kentville Research Development Centre (KRDC), therefore, difference between locations are possible to be found.
The first table shows the temperature base 5⁰ C and base 10⁰ C from 2018 until 2021 accumulated each year from March 1 until July 12.
At the end of each section, it’s possible to see the average of the last 5 and
10 years respectively.
|
Category |
2018 |
2019 |
2020 |
2021 |
5 year average |
10 year average |
|
Plant development
(Base 5ºC) |
801.6 |
718.0 |
807.5 |
906.4 |
799.7 |
818.6 |
|
Insect development
(Base 10º) |
439.1 |
349.4 |
455.3 |
499.1 |
427.2 |
438.5 |
Figure
1. Degree day accumulations as of July 13, 2021. All data are taken from the Kentville weather
station, based on a start date of March 1, and calculated using the single sine
method.
The degree accumulation continues as the highest of the last
3 growing seasons, which has impacted positively in grapevine growth. As in the
case of last week the difference between 2021 and 2020 has diminished, this
time to 43.8. Based on 10⁰ C, 2021 has 499.1 which is above the average temperature
of the last 5 and 10 years with 427.2 and 438.5 respectively.
In the following
column graph, it’s possible to see the values from 2004 until 2021 and at the
end you can see the average of the last 5 and 10 years respectively.
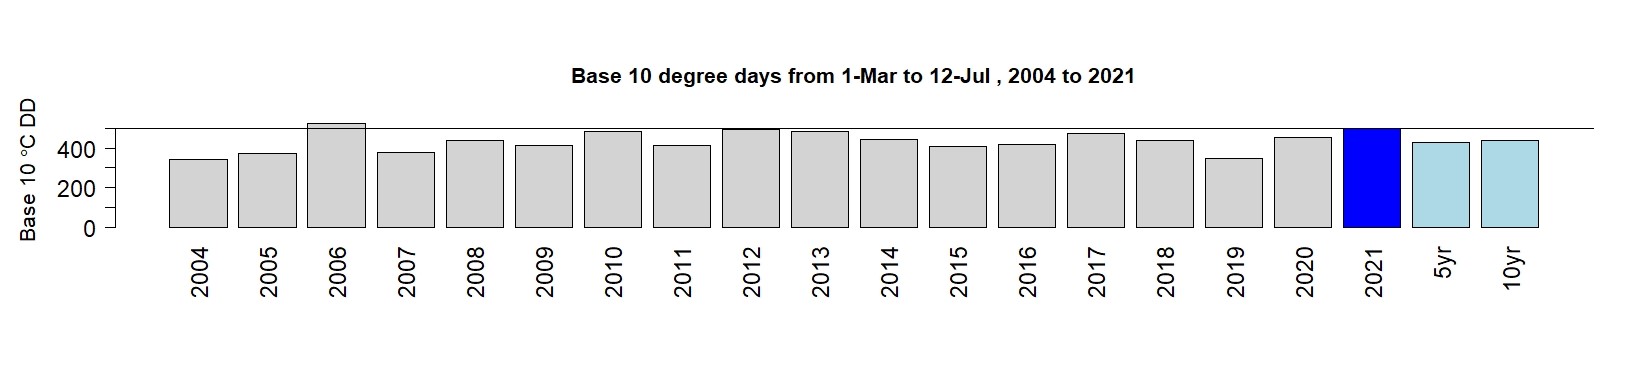
Figure 2. Degree day accumulations as of July 12,
2021 base 10⁰ C.
All data are taken from the Kentville weather station, based on a start
date of March 1, and calculated using the single sine method.
In this graph we can pay attention to 2021 compared with the
last 3 years, there is a larger difference especially compared to 2019. It’s
possible to see some similarities with 2012 and 2010, while it’s interesting to
compare with 2006 where the accumulation, as in the case of last week, is even
higher than 2021.
In terms of precipitation, the following graph shows the
precipitation from January 1st until July 13, from 2012 until 2021
and including the average of the last 10 years.

The black line shows the 10 years average and the red line
2021, which is slightly below and with a similar pattern compared to 2020, but
at this time lower than 2020. Important to consider that the precipitation is measured
at KRDC, which can vary depending location. As in the case of last week the
season 2012 represents the lowest precipitation values in the graph, meanwhile
2019 has the highest values.
See you in the next update!